Procurement savings are a crucial aspect of effective procurement management as they directly contribute to the organisation’s bottom line.
It’s important that both finance and operational teams see the methodology used to calculate these savings as credible and fair, especially since the objective is to include these benefits in the budgeting process. This guide sets out a clear approach to help you quantify and report procurement savings consistently and credibly.
The Importance of Understanding Cost Savings
Defining Cost Savings Generally
Before diving into the specifics, let’s define what we mean by “cost savings.” In procurement, cost savings are the reductions achieved by the organisation in relation to any project within the 12 months following its completion – or for the lifetime of such savings or benefits, whichever is shorter. Remember, any savings or benefits achieved outside of this period do not constitute cost savings, even if they continue thereafter.
Best practice suggests setting targets for both Incremental Savings and Total Savings each year. This ensures that the team remains incentivised to achieve incremental savings and not rest on their laurels during years with high rollover savings.
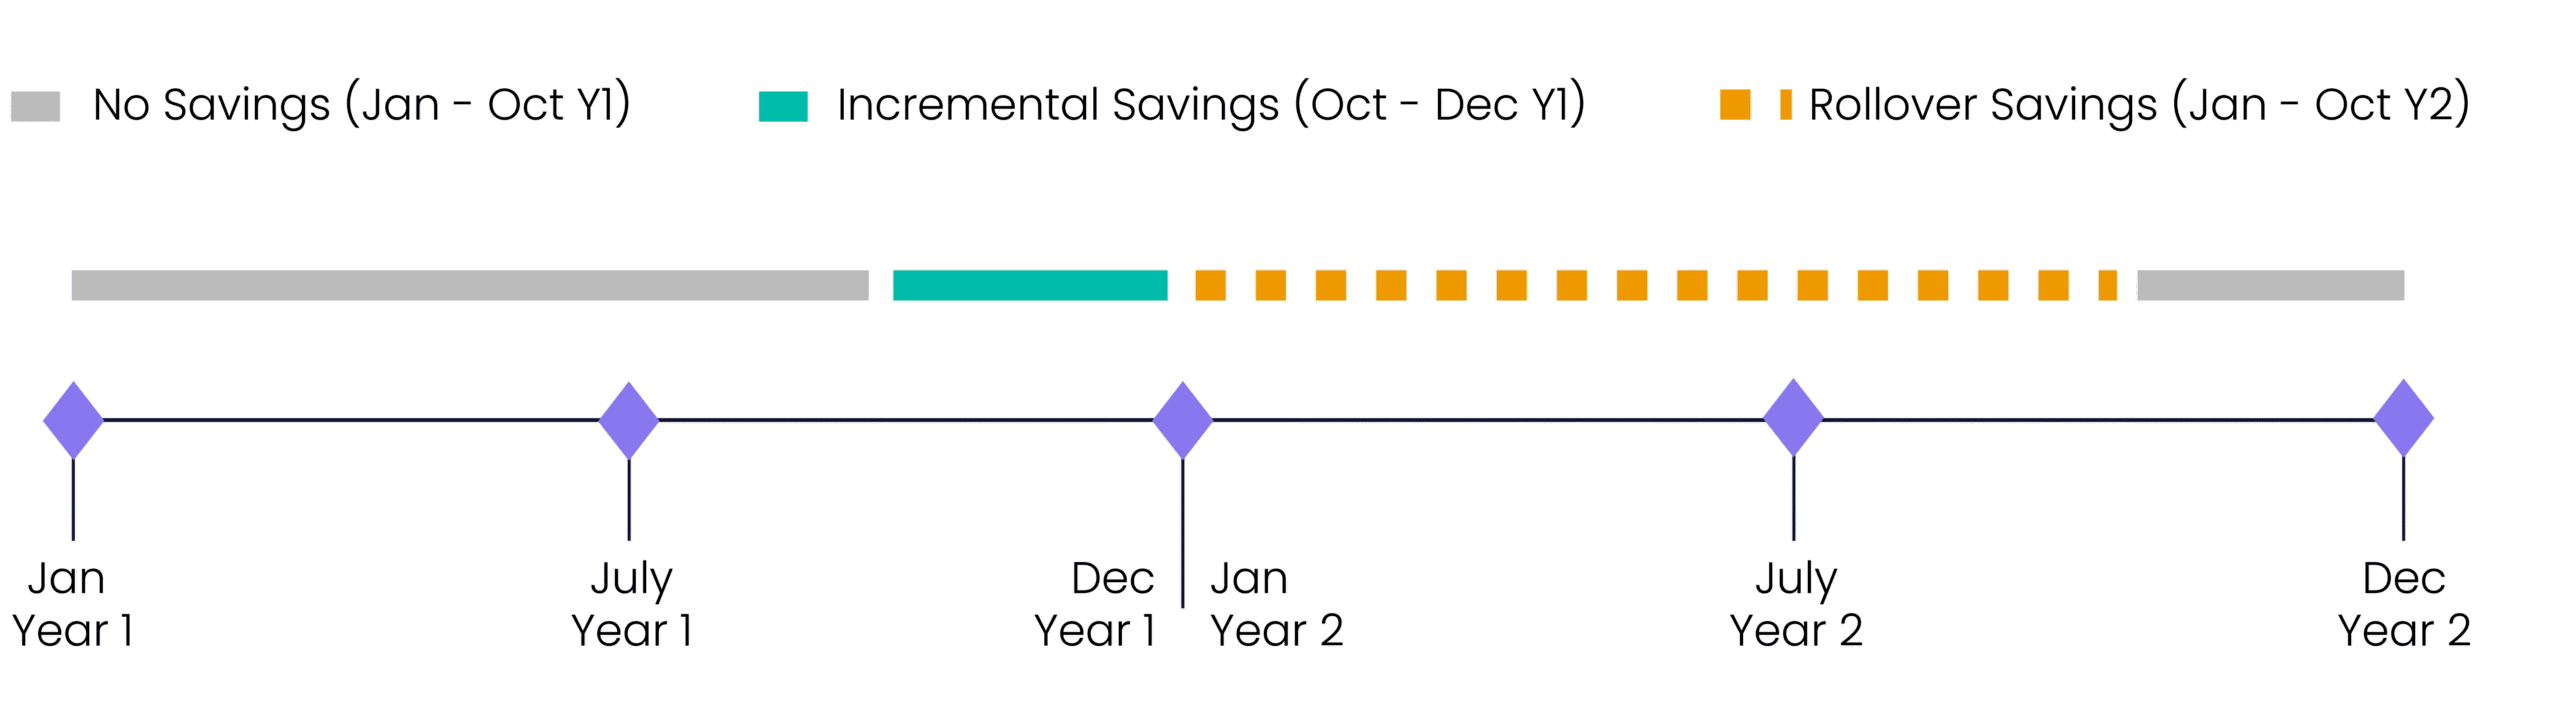
To align with your organisation’s reporting and budgeting calendar, incremental savings are defined as the portion of the 12-month savings from a project that accrues in the current financial period. Whereas rollover savings are the remaining portion of the 12-month savings that accrue in the following financial period.
For example, if a project delivers cost reduction savings from November in an organisation whose financial period runs from January to December, the incremental savings will be within financial year: the savings achieved from January year 1 through to March 31st year 1. The Rollover Savings in year 2 will be the savings achieved from April year 2 through to February year 2.
Types of Cost Savings
Cost Reduction Savings
Cost reduction savings result from a reduction in price, quantity, or a change in payment days. Depending on the relevant factor, the equation to calculate the saving will alter slightly:
- Price Reduction Savings: Achieved by reducing the price of a product or service.

Price Reduction Saving = (Baseline Price – Actual Price) x Actual Volume
- Demand Reduction Savings: Achieved by reducing the volume purchased, calculated as follows:
Demand Reduction Saving = (Baseline Price x Forecast Volume) – (Actual Price x Actual Volume)

- Revenue Generation Benefit: Generated by increasing organisation revenue, calculated as follows:
Revenue Generation Benefit = (Baseline Revenue x Forecast Volume) – (Actual Revenue x Actual Volume)
- Recovered Money Benefit: Achieved by recovering overpaid sums, often seen in scenarios like electricity bill audits.
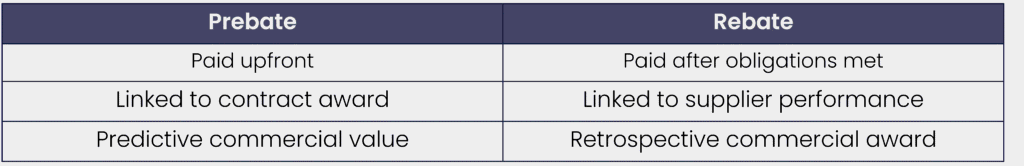
- Prebate Benefit: Payments received from a supplier contingent on contract awards or extensions, calculated as follows:
Revenue Generation Benefit = (Baseline Revenue x Forecast Volume) – (Actual Revenue x Actual Volume)
- Rebate Benefit: Payments from suppliers for fulfilling contract obligations. Best practice suggests claiming Rebate Benefits only once and incorporating them into the Baseline Price for future calculations.
Working Capital Benefits
Working Capital Benefits stem from increased length in payment days, allowing the organisation to retain capital longer. These are calculated annually by comparing:
- Baseline Payment Days (as of April 1) vs. Actual Payment Days (as of March 31)
Working Capital Benefit = (Managed Spend / No. of days in current year) x (Actual Payment Days – Baseline Payment Days) x Cost of Capital

Cost Avoidance Savings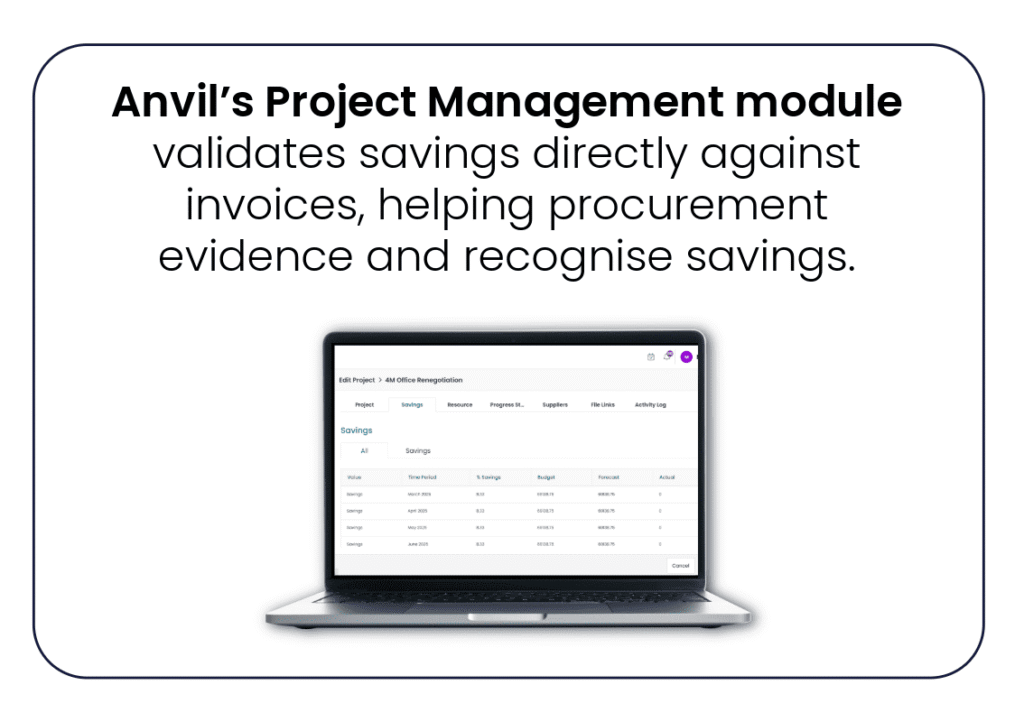
These savings are achieved by mitigating unbudgeted expenditures. Examples include negotiating down expected insurance premiums or negotiating for a warranty extension. They must be documented and approved by Finance. Cost avoidance savings are notoriously difficult to track as they are expenses that haven’t been incurred yet.
Price Reduction Inflation Mitigation Savings
These savings mitigate category inflation impacts, calculated as follows:
- Where Actual Price < Baseline Price
Price Reduction Inflation Mitigation Saving = (Baseline Price – Actual Price) x Actual Volume
- Where Actual Price > Baseline Price:
Price Reduction Inflation Mitigation Saving = ((Baseline Price x (1 + Category Inflation)) – Actual Price) x Actual Volume
Demand Reduction Inflation Mitigation Savings
- Achieved by reducing purchased volumes to mitigate inflation impacts:
Demand Reduction Inflation Mitigation Savings = ((Baseline Price x (1 + Category Inflation)) x Forecast Volume) – (Actual Price x Actual Volume)
Average Quotation Savings
- Derived from projects where historic pricing isn’t used:
Average Quotation Savings = (Average Suitable Quotation Price – Actual Price) x Actual Volume
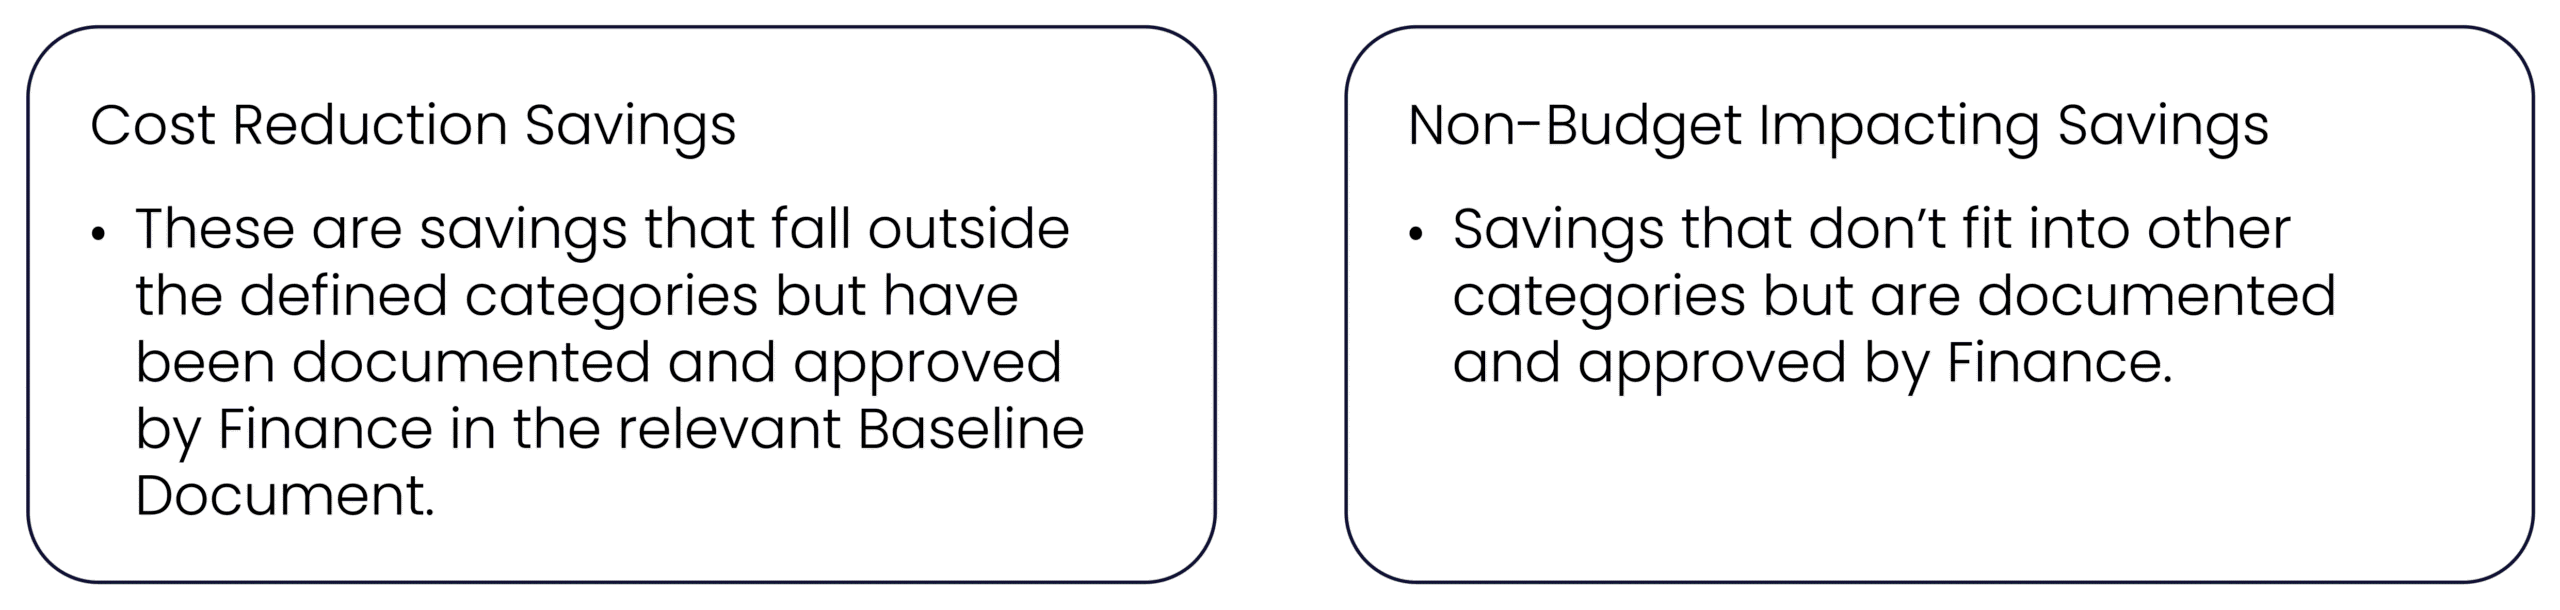
Other Agreed Savings
Evidence of Cost Savings
Finance and Procurement must collaborate to monitor and record cost savings. Qualified finance personnel should work with the team to ensure savings are reviewed. Cost Savings are recognised upon receipt of documentary evidence, such as invoices or entitlement documents. A well-defined methodology ensures credibility and consistent reporting, ultimately benefiting the organisation’s financial health.