Our Customers
Key Features
Always on fully automated spend & supplier management. We deliver technology which guides users through opportunity discovery dashboards driven by unique insights, which together, maximise your ROI. Our solution allows clients to leverage our previous engagements as well as our own deep procurement expertise.
We deliver technology which enables the procurement professional through opportunity dashboards and unique insights which maximises the impact of investing in the tool.

Spend
- Full supplier classification with easy to organise views
- Innovative procurement metrics deliver new and useful insights
- Automatic savings opportunity generation
- Data enhanced with 000’s of indices & benchmarks
Our Solution - Spend Analytics
How it Works

- Extract
- Cleanse
- Classify
- Enrich
- Analyse
- Visualise
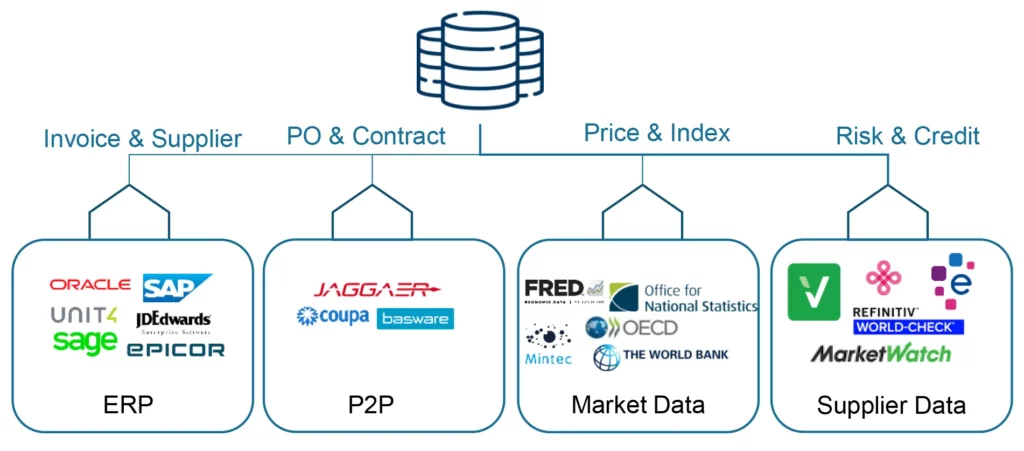
Architected to bring together data from many different data sources, we map your data to a standard data model to create a common representation of your data. Additional fields are not lost and can be used to provide customer specific dimensions to analysis.
Proprietary technology for language translation as well as invoice & contract machine reading means that no data sources are out of reach.

Our tooling processes the supplier name learning new aliases, entities and common misspellings as it goes.
We have innovated in this area because we know that by correctly identifying the supplier, our analytics work better and faster.
Our market data connectors enrich the supplier with turnover, headcount, and other attributes to support focused analytics.
The cleanse process goes further and handles date and currency consistently, which are attributes that can trip up the unwary.

Our classification strategy uses multiple machine learning models to provide the perfect combination that leverage our collective learning over time, while the Client Model capture client specific classification
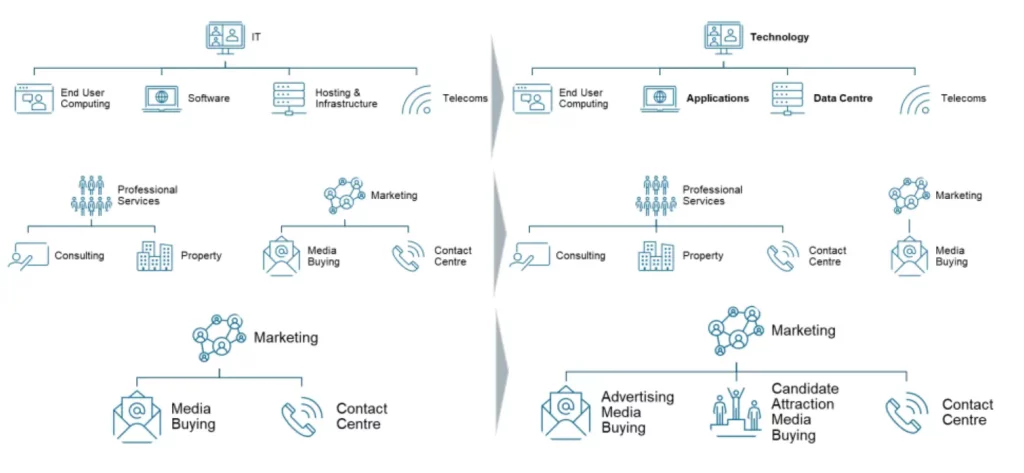
Sector specific hierarchy extensions allow us to reflect distinctive needs of clients.
We use a standard taxonomy based on UNSPSC, which has enabled us to develop innovative benchmarks.
A configurable pipeline of components means classification strategies can be tailored both in terms of the components used and the order in which they are applied.

Our common taxonomy is a “Rosetta Stone” allowing us to enrich the analysis with category specific insight such as carbon emissions, inflation and risk
To maximise the benefits of our analytics the enrichment process also caters for classification at the L1, L2 level creating carry down values, so that calculations include all data
However, clients typically have their own taxonomies and we have tools to enable us to play your data back to you the way you want to see it without losing any of the valuable enrichment. These include, renaming, pathname mapping and embedding business logic

Four key measures x-ray each category down to L3 and draw your attention to savings opportunities and procurement levers using experience & benchmarks derived from thousands of engagements
Materiality – A measure of both the scale of your spend and how easy it may be to access
Fragmentation – A measure of how fragmented your spend in each category is compared to thousands of engagements
Churn – A measure that helps to identify when you might wish to introduce competition or innovation in a category or where new suppliers are diluting your spend
Growth – Identifies fast growing suppliers
These measures feed into an algorithm developed by subject matter experts to identify opportunities and insight
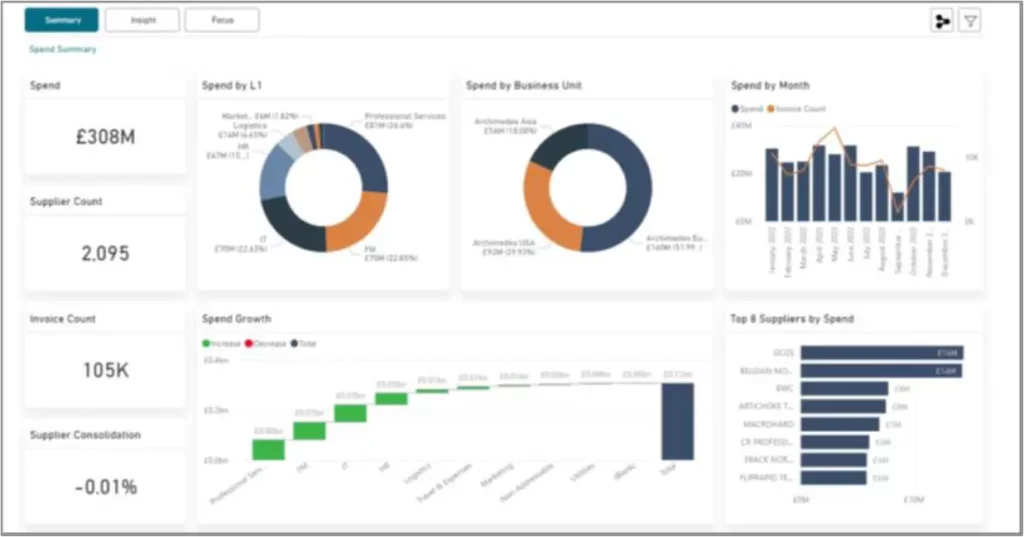
Information is arranged by persona to support differing user needs
Summary – A distillation of key spend & operational measures to support procurement leaders
Insight – Algorithms that leverage category expertise deliver data driven insights to category managers
Focus – A single source of normalised, standardised enterprise data available to download and combine as required
All visuals are simple, clean with intuitive navigation to related

Find out more
Request our demonstration suite
